Don’t Overload with Jargon: Avoid excessive data terms that confuse recruiters.
Don’t Exceed Two Pages: Keep your resume concise, focusing on relevant experience.
Don’t Omit Dates: Include employment dates for career context.
Don’t Use Generic Templates: Tailor your resume to data visualization expert roles.
Don’t List Irrelevant Skills: Focus on visualization skills like Tableau, not unrelated ones.
Don’t Skip Metrics: Quantify results wherever possible.
Don’t Use Complex Formats: Avoid ATS-unreadable graphics.
Don’t Ignore Soft Skills: Include storytelling and communication examples.
Don’t Include Outdated Experience: Omit jobs over 15 years old unless relevant.
Don’t Forget to Update: Refresh for trends like AI-enhanced visuals or AR/VR.
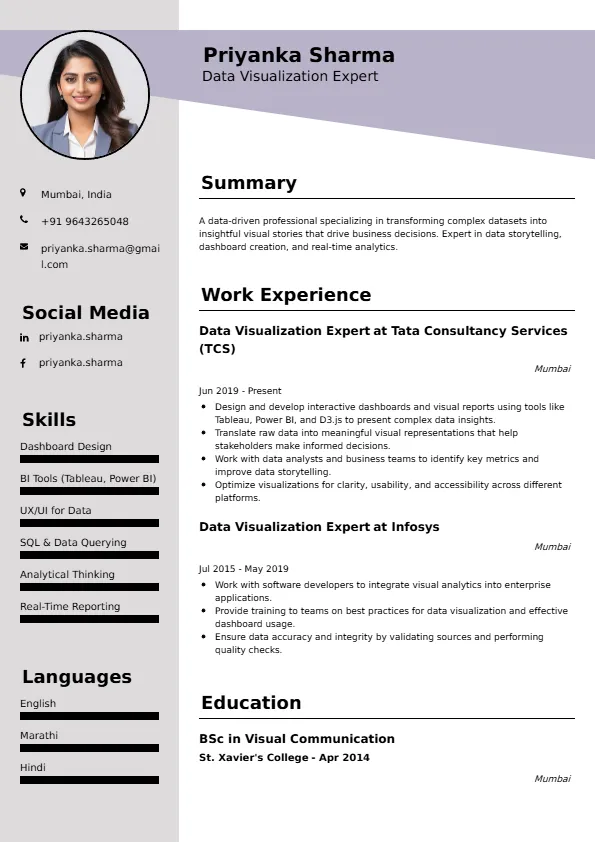
Data Visualization Expert
Welcome to our Data Visualization Expert resume sample page! This expertly crafted resume template is designed to showcase your expertise in storytelling through charts, dashboards, and interactive visuals. Whether you're mid-level or senior, this sample highlights key skills like Tableau, Power BI, and D3.js, tailored to meet top employers’ demands. Use this guide to create a compelling resume that stands out and secures your next career opportunity.Build a Standout Data Visualization Expert Resume with Superbresume.com
Superbresume.com empowers Data Visualization Experts to craft resumes that highlight their visual storytelling and tool expertise. Our platform offers customizable templates tailored for data roles, emphasizing skills like Tableau, Power BI, and D3.js. With ATS-optimized formats, expert-written content suggestions, and real-time resume analysis, we ensure your resume aligns with job descriptions. Showcase your experience in interactive dashboards, UX design, or insight communication with confidence. Whether business intelligence or UX data, Superbresume.com helps you create a polished, results-driven resume that grabs hiring managers’ attention and lands interviews.
How to Write a Resume for a Data Visualization Expert
Use Reverse-Chronological Format: List recent visualization roles first, focusing on dashboards or reports.
Highlight Certifications: Include Tableau Desktop Specialist or Microsoft Power BI Data Analyst to boost credibility.
Quantify Achievements: Use metrics, e.g., “Created dashboards viewed by 1,000+ users monthly.”
Incorporate Keywords: Use terms like “interactive visuals,” “data storytelling,” or “Tableau” from job descriptions for ATS.
Detail Technical Skills: List tools like Tableau, Power BI, or D3.js in a skills section.
Showcase Projects: Highlight portfolio pieces with outcomes.
Emphasize Soft Skills: Include design thinking and communication, demonstrated through stakeholder presentations.
Keep It Concise: Limit your resume to 1-2 pages, focusing on relevant visualization experience.
Proofread Thoroughly: Eliminate typos or jargon for a professional document.
Interactive & Real-Time Dashboards: Highlight streaming data with Power BI or Looker, essential for dynamic reporting.
Storytelling Emphasis: Include narrative techniques with data, a key trend for impactful presentations.
Accessibility & UX Design: Emphasize WCAG-compliant visuals for inclusive designs.
Multi-Tool Proficiency: Showcase Tableau, Power BI, and D3.js for versatile roles.
Metrics-Driven Outcomes: Use quantifiable results like “increased engagement by 40% with interactive charts.”
Cloud-Based Visualization: AWS QuickSight or GCP Data Studio for scalable solutions.
Augmented Reality Visuals: Include AR/VR data experiences for innovative roles.
Choose Superbresume.com to craft a Data Visualization Expert resume that stands out in analytics. Our platform offers tailored templates optimized for ATS, ensuring your skills in Tableau, Power BI, and storytelling shine. With expert guidance, pre-written content, and real-time feedback, we help you highlight achievements like user engagement or insight delivery. Whether you're mid-level or senior, our tools make it easy to create a professional, results-driven resume. Trust Superbresume.com to showcase your visual expertise and land interviews with top employers. Start building your career today!
20 Key Skills for a Data Visualization Expert Resume
| Tableau | Power BI |
| D3.js | Looker |
| Data Storytelling | Interactive Dashboards |
| UX Design | WCAG Accessibility |
| AI-Enhanced Visuals | Real-Time Reporting |
| AWS QuickSight | GCP Data Studio |
| AR/VR Visuals | SQL for Data Prep |
| Communication | Collaboration |
10 Do’s for a Data Visualization Expert Resume
Highlight Certifications: List credentials like Tableau Desktop Specialist prominently.
Quantify Achievements: Include metrics, e.g., “Created dashboards viewed by 1,000+ users.”
Use Action Verbs: Start bullet points with verbs like “designed,” “visualized,” or “optimized.”
Showcase Projects: Detail portfolio pieces with outcomes.
Include Soft Skills: Highlight storytelling or communication through examples.
Optimize for ATS: Use standard section titles and avoid complex formatting.
Keep It Professional: Use a clean, consistent font and layout.
Add a Portfolio Link: Include a link to a portfolio with visual samples.
Proofread Carefully: Ensure no typos or errors for professionalism.
10 Don’ts for a Data Visualization Expert Resume
5 FAQs for a Data Visualization Expert Resume
Prioritize Tableau, Power BI, and data storytelling. Include certifications like Tableau Desktop Specialist.
Use standard section titles, avoid graphics, and include keywords like “interactive visuals” or “data storytelling.”
Yes, a portfolio with visual samples can set you apart.
Detail project scope, tools used (e.g., Tableau), and outcomes like increased engagement.
Use a reverse-chronological format to emphasize recent visualization achievements.
Get 5x more interviews with our crafted Resumes. We make resumes that land jobs.

Get a Free Customized Cover Letter with Resume Expert Advice
with every resume order placed, you will get a free Customized Cover letter.